题目内容
(请给出正确答案)
题目内容
(请给出正确答案)
[主观题]
Part BBelow is a graph showing how gender influenced the death rate due to heart attacks i
Part B
Below is a graph showing how gender influenced the death rate due to heart attacks in Hong Kong between 2001 and 2004. Look at the graph and write an essay of about 120 words that describes the information conveyed in the graph.
Heart Attacks in HongKong, 2001—2004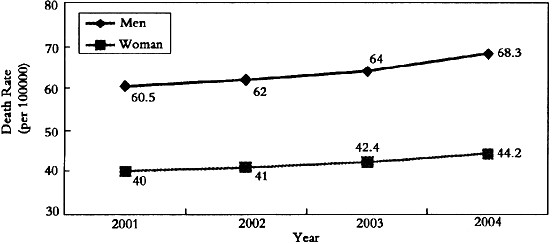
查看答案

 如果结果不匹配,请 联系老师 获取答案

 更多“Part BBelow is a graph showing…”相关的问题